We need better data and tools for decision-making. Our research advances the collection, methodology, and analysis of multimodal data that supports professionals and researchers in understanding and predicting human travel behavior in order to optimize those systems for both the providers and users. These new models and tools examine the implications of changes to the system on a range of outcomes including equity, the environment, and health. Download the full literature review of NITC research in multimodal data and modeling here, or you can download our two-page summary here.
In a series of NITC Research Roadmaps, we surveyed a decade of contributions across six areas of transportation research funded by the National Institute for Transportation and Communities (NITC).
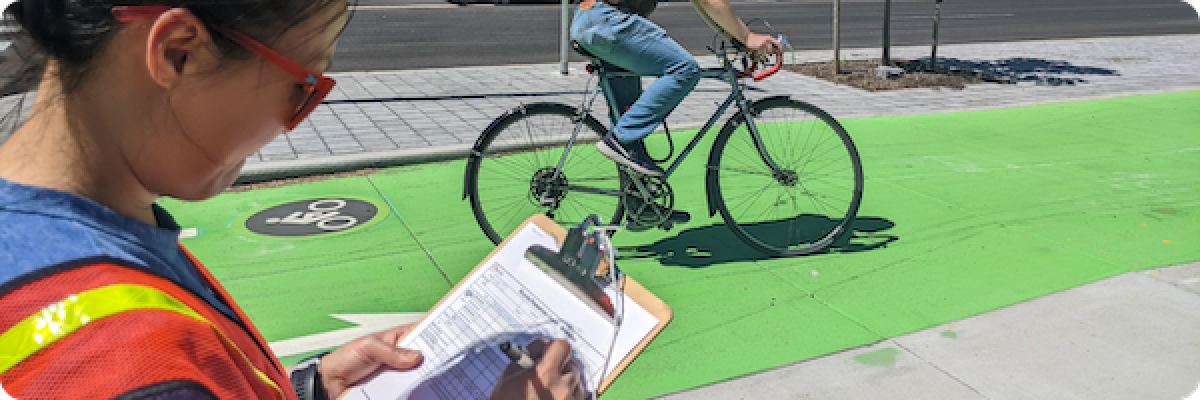
Nonmotorized Count Data
Counts of people walking and bicycling are important for monitoring trends, planning new infrastructure, and analyzing safety. NITC research has advanced the state of the practice by improving data quality and standardization, as well as by integrating new technologies. One study fused traditional count data with emerging data sources from GPS and mobile devices to estimate network-wide bicycle volumes, and another study is looking into a similar method for crowdsourcing pedestrian data. NITC researchers have explored methods to assess passively collected and crowdsourced data for accuracy, representation, completeness, and bias. Improved sensor technology has a role to play as well: one recent NITC study developed a new intelligent multimodal traffic monitoring device using low-cost mmWave radar.
Transit Data
To assess public transportation in a holistic way – in terms of rider experience, travel time reliability, accessibility, safety, efficiency, and environmental and economic impacts – practitioners need a phenomenal amount of data from a variety of sources. NITC researchers have made great strides in making it easier to gather and use transit-related data. One NITC study used high-resolution bus data to create more precise and statistically valid trip time models. Another compared bus stop-level data with demand-responsive parking data to show the effect nearby parking prices had on bus ridership. A third study used built environment factors – density, diversity, and walkability – to classify neighborhoods and found that transit-oriented development residents walk more, take transit more, and spend less on transportation than their counterparts in other types of neighborhoods.
Survey Data
Travel surveys provide information about travel patterns that is necessary for planning and policymaking. However, current survey methods do not adequately capture active transportation trips, and may not accurately represent marginalized populations. NITC researchers have significantly refined travel survey methods, improving accuracy and making the data more context-sensitive. One NITC study recommended the creation of pooled samples with comparable and consistent data from cities, which could be beneficial for understanding relationships between travel behavior and the built environment. Other NITC studies have looked at making data collection methods more inclusive of marginalized populations through strategies like increased transparency, protection of privacy, and more robust community engagement.
Applications of Multimodal Data: Equity
Despite recent improvements in household transportation survey methodologies, people of color and immigrant groups remain under sampled and understudied. A NITC study linked census population and housing data to a stratified random sample of households from the Oregon Household Activity Survey and found that the survey consistently overrepresented white households and underrepresented nonwhite households across the greater Portland area. The study developed a set of recommendations to improve the representation of diverse populations in travel surveys. Adoption of cashless fare systems has created barriers for lower-income transit riders. One NITC study explored the costs for agencies to maintain some cash options and found that simple approaches, such as cash collection onboard buses, can be quite cost effective at ensuring transit remains accessible and easy for all riders. Transit agencies currently lack guidelines for assessing the social equity impacts of replacing flat fare with distance-based fare structures. Another study found that shifting to a distance-based fare system may benefit low-income, elderly, and non-white populations; however, the effect is geographically uneven, and may be negative for members of these groups living on the urban fringe.
Applications of Multimodal Data: Economics
A national NITC study explored how investments in bicycle and pedestrian-focused street improvements can impact the economic vitality, business activities and neighborhood equity in surrounding areas across six cities. It found that, generally, street improvements yielded positive or non-significant impacts on business performance. Proximity to fixed guideway transit stations led to higher rents for commercial spaces and higher regional share of jobs closer to the transit station. One NITC study estimated development outcomes in response to transit and found market rent increases with respect to Fixed Guideway Transit (FGT) station proximity for all commercial types, but not for bus rapid transit (BRT). However, BRT systems are associated with positive development and job location outcomes. An earlier study revealed that BRT corridors gained new offices and multifamily apartments, and BRT station areas gained jobs in the manufacturing sector at a faster pace than the rest of the county.
Applications of Multimodal Data: Safety
Signal timing treatments can improve bicycle safety. A NITC study analyzed the operational impacts of various signal timing treatments on right-hook bicycle-vehicle conflicts. The research found that while a split leading bike interval treatment was useful in mitigating conflicts during the lead interval, the risk for bicyclists was then shifted to the stale green portion of the phase. The study also revealed that significant confusion was exhibited by both cyclists and drivers in a mixing zone, where bike and car traffic merged. The 2010 Highway Safety Manual provides methods for predicting the number of motor vehicle crashes on various facilities, but it includes a simplistic method for predicting the number of bicycle-related crashes. A NITC study developed the first bicycle-specific safety performance functions for segments in the U.S. and found that motor vehicle volume is a leading factor associated with more crashes between drivers and bicyclists. Bicyclist exposure, population density, and percent retail land use are also predictive.
Conclusion
Researchers and practitioners share common concerns about current data collection and processing strategies, especially a lack of standardization and validation. These limitations likely result in incomplete, inefficient, or even biased modeling strategies across all travel modes. Considering rapid changes in emerging data sources and technologies, as well as new travel modes, there is a clear need for greater scientific guidance and innovation on data collection, analysis, and modeling strategies.
What are the impacts and key findings of our research on how we can better collect, use, and model multimodal data? Learn more about some impact stories below.
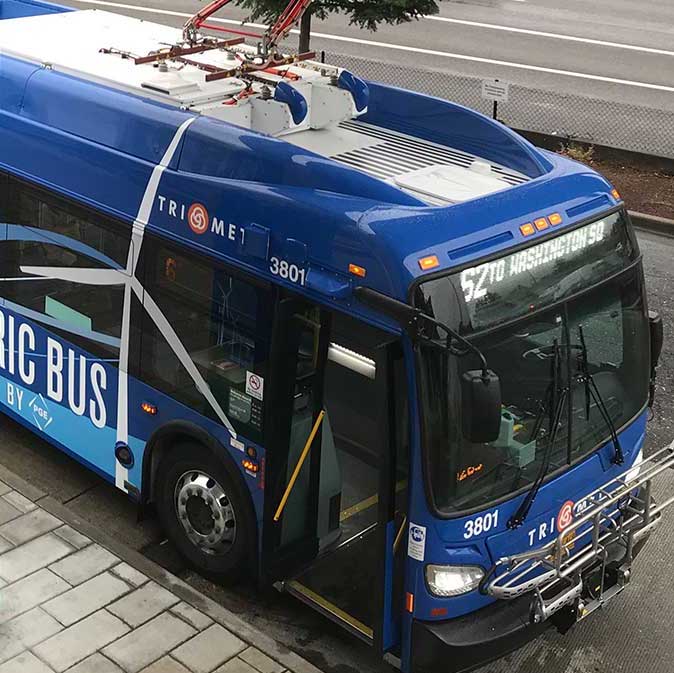 The transit industry is rapidly transitioning to electric buses because of the environmental and financial benefits they can offer, such as zero emissions, less noise, and lower maintenance costs. Electric buses also produce significantly lower greenhouse gas emissions than diesel, diesel hybrid and natural gas-powered buses, which is good news for tackling our climate crisis. Led by Xiaoyue Cathy Liu of the University of Utah, NITC researchers have created a web-based modeling tool for the Utah Transit Authority that lets transit providers explore the impacts of changing their system over to electric buses. The tool allows agencies to plan the most effective way to transition while prioritizing environmental equity, focusing first on low-income areas with poor air quality. Developed a modeling tool for transit agencies to determine how best to deploy battery-electric buses and stations that is both cost effective and consistent with agencies equity goals.
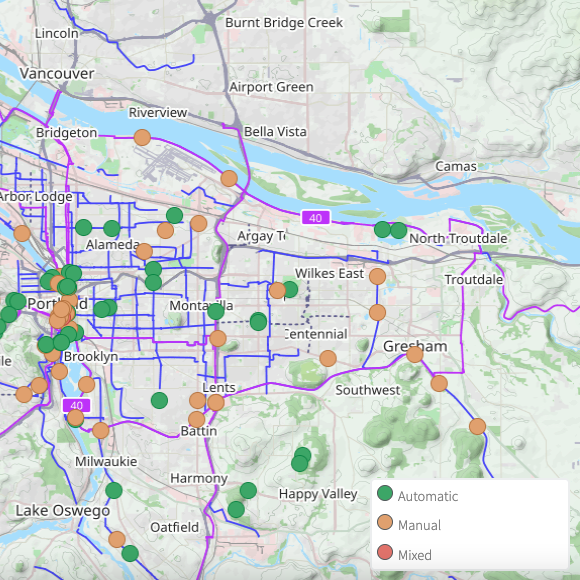 A national non-motorized count data archive, BikePed Portal provides a centralized standard count database for public agencies, researchers, educators, and other curious members of the public to view and download bicycle and pedestrian count data. It includes automated and manual counts from across the country, and supports screenline and turning movement counts. Pooling funds, the data archive was established in 2015 by researchers at Portland State University with project partners at Federal Highway Administration and many transportation agencies.
 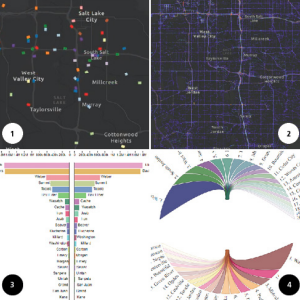 The University of Utah has a new data visualization service to offer to state DOTs and other agencies. Using Small Starts funding from NITC, researcher Nikola Markovic and his team have developed a suite of visual analysis tools to demonstrate how GPS trajectory data can help accurately model and analyze mobility trends. These data are typically purchased from vendors, which means that transportation agencies must first understand the benefits before they decide to invest in data acquisition. To help agencies see that value, the research team purchased one month of Utah trajectory data to work with, which included detailed information about 2.5 million trips. The researchers created several visual analysis tools to highlight the usefulness and value of GPS trajectory data in transportation planning and performance measurement. The interactive online animations included: Vehicles Traveling; Utah Variable Traffic Density Heatmap; Trips Between Counties, Chord Diagram; and Trips Entering and Exiting Salt Lake City.
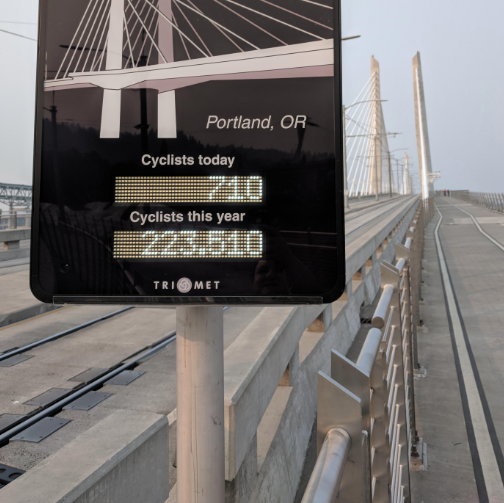 In order to make sure bicyclists' needs are considered when improving a transportation system, planners and engineers need to know how many people are biking, and where. Traditional bicycle counters can provide data for limited sections of the bike network, often these counters are installed at important locations like trails or bridges. While limited in location, they count everyone who bikes by. Meanwhile, GPS & mobile data cover the entire transportation network, but that data only represents those travelers who are using smartphones or GPS. Combining the traditional location-based data sources with this new, crowdsourced data could offer better accuracy than any could provide alone.
