
How Social Distancing Gave Me A Flat Tire… On My Commuter Bike
Authored by Tammy Lee, Transportation Data Manager, Portland State University
For a deeper dive into bicycle volume data, watch the May 8 seminar with Tammy Lee and Kristin Tufte: Creating And Using A Publicly Available Multimodal Transportation Data Archive. Also, check out her earlier blog post on motor vehicle traffic volumes.
The weather these past few weeks has been beautiful: sunny, not too hot, not too cold, cherry trees blossoming… the ideal biking weather marred by a less than ideal pandemic.
Are social distancing measures affecting bike trips in Portland, OR? Maybe. Personally? Yes.
First, let’s get a few things out of the way before we provide summary observations:
Analyzing bike data is not as “easy” as evaluating vehicle traffic data: the infrastructure for monitoring bike (and pedestrian) data isn’t anywhere close to how vehicle traffic is monitored. There just aren’t many bicycle count detectors. So if one detector stops working then what little data that was available in the first place became that much littler.
Evaluating bike data during the spring in Portland can be messy due to weather related effects (I hate riding my bike in the rain).
We intend to provide a more thorough analysis at a later point when we have more temporal and spatially available data. This is just a snapshot of observations to get the conversation started.
So what are we observing so far?
We looked at the Tilikum Crossing and Hawthorne Bridge, key crossings in Portland,because continuous count data are available for January 2020 to now. (Figure 1). The first social distancing measure was announced on March 12 (schools closed), and the “stay-at-home” order was announced on March 23. The Hawthorne Bridge shows a decline in volume around the week of March 16, almost half the weekday volume compared to previous weeks. The Tilikum shows a decrease in volume about a week later (March 23), but then rebounds the week of April 6, to levels similar to pre-stay-at-home weeks. The seemingly different pattern in bike volumes might be due to differences in types of cyclists (commuters versus recreationalists), destination (Tilikum connects to the OHSU versus Hawthorne leading to multiple major downtown employers).
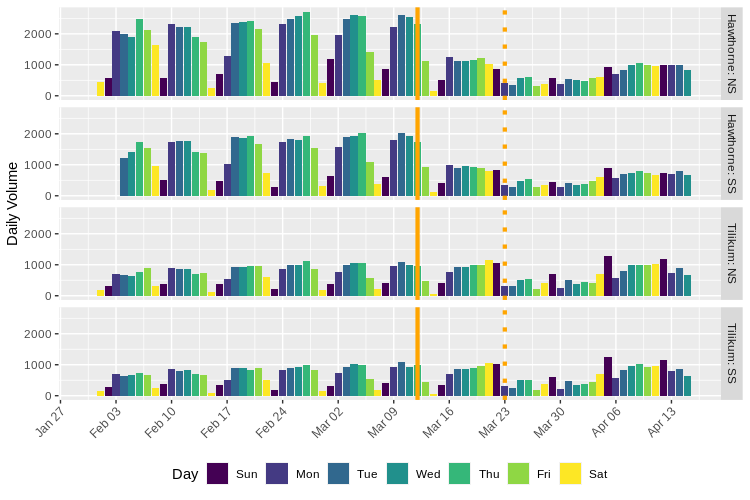
Figure 1. Daily bike volume across Hawthorne Bridge and Tilikum Crossing. NS = northside; SS = southside. The solid orange line (March 12) represents the closing of schools; the dotted orange line (March 23) represents the “stay-at-home” announcement.
If we use the week of February 22 as a reference, we get a slightly clearer picture of the changes in bike volume compared to each corresponding day of the reference week (e.g. Monday to Monday, Tuesday to Tuesday, etc.) (Figure 2), where post-stay-at-home, weekday bike volumes decline, but Sunday volumes increase, especially on the weekends (those sunny Sundays we’ve been having).
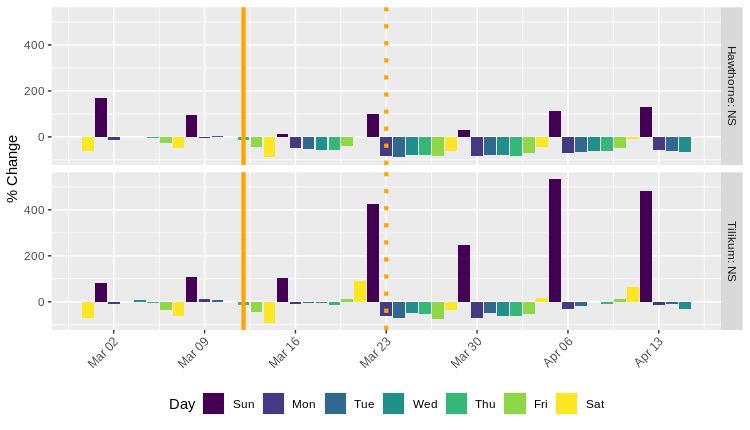
Figure 2. Change in daily bike volume using the week of February 22 as a reference week compared to each corresponding day (Monday to Monday, Tuesday to Tuesday, etc.) Only the north side of the Hawthorne Bridge and Tilikum crossing are shown because the south side of each bridge showed similar trends.
But wait, you’re probably wondering – what about comparing daily bike volumes to this time last year, instead of using the week of February 22 as a reference week? After all, we must look at seasonality effects; it’s April, now, doesn’t the weather explain what trends we’re observing more than the social distancing measures we’ve been following?
Maybe, maybe not.
Unfortunately, we’ve only been able to compare 2019 and 2020 bicycle volumes along the north side of the Tilikum Crossing because both sides of the Hawthorne Bridge and the south side of the Tilikum Crossing all have weeks of missing data around this time last year (perhaps the battery on the data logger died). If we just look at the north side of the Tilikum Crossing and compare bicycle volumes to this time last year, adjusting to the day of week, then it looks like there's been a decrease in bicycle volume since the first social distancing measure, except on recent Saturdays and Sundays (Figure 3).
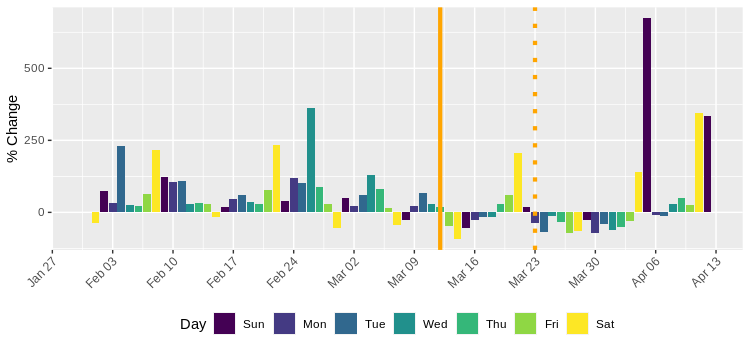
Figure 3. Change in volume compared to same time last year along the northside of the Tilikum Crossing.
How does this look if we compare the weather to this time last year?
It also looks like weather is an influencing variable in the observed decrease in bicycle volume (Figure 4). But remember, correlation doesn't equal causation. There’s a huge increase in bike volumes on the past two weekends, though the temperatures were not that much different than the same days last year. This might indicate that more people are recreating on the weekends. This would coincide with the times after most state parks and federal lands were closed for recreation.
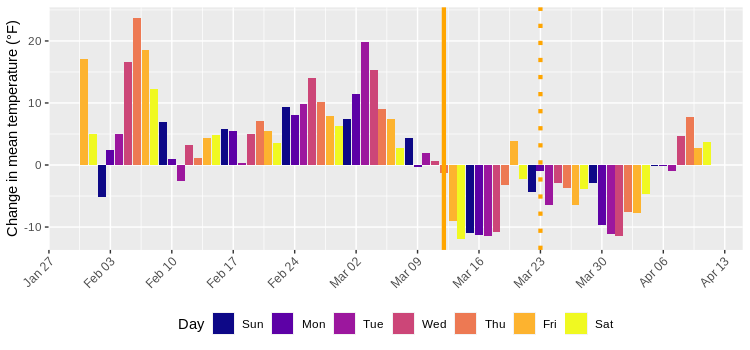
Figure 4. Change in temperature compared to this time last year.
At the moment we can’t say for sure what the effects of COVID-19 are on bicycle volume in Portland, Oregon. We can speculate and think something is going on based on personal observations and habits, but to make a definitive statement without enough data is wheelie bad and worse than my pun.
What we do want to say is that we’re looking into the effects of COVID-19 on bike volume and to start a conversation on the effects of COVID-19 on other modes of transportation. Our goal is to continue collecting and analyzing data, so that in a few months we’ll be able to tell a story backed up by data and sound science. Hopefully by then I’ll be back to riding my bike to work; if not, I’ll be one of those people contributing to the increased weekend bike riding.
ABOUT THE AUTHOR
 Tammy Lee, Ph.D.
Transportation Data Program Administrator
Tammy is working on a variety of projects for TREC, including documentation, data synthesis, analysis, and visualization supporting ongoing work with PORTAL and Bike-Ped Portal. Prior to joining TREC, she worked as a data scientist for a political digital media consulting firm.
The Transportation Research and Education Center (TREC) at Portland State University is home to the National Institute for Transportation and Communities (NITC), the Initiative for Bicycle and Pedestrian Innovation (IBPI), and other transportation programs. TREC produces research and tools for transportation decision makers, develops K-12 curriculum to expand the diversity and capacity of the workforce, and engages students and professionals through education. For resources and tools for remote teaching during the quarantine period, check out our TREC and COVID-19 resource page.