
Improved Methods to Evaluate Travel Time Reliability
Travel time reliability – or the consistency and dependability of travel times from day to day, and at different times of day – is a key metric that significantly affects people’s travel behavior. Since businesses rely heavily on transportation systems, an unreliable transportation network can also impact the economic competitiveness of urban areas. As such, reliable travel times are important for transportation agencies to promote economic stability within a community. Having accurate methods to evaluate reliability is important for both transportation practitioners and researchers.
A new report from Portland State University offers an improved method for determining the confidence interval of travel time reliability metrics. Researchers Avinash Unnikrishnan, Subhash Kochar and Miguel Figliozzi of PSU’s Maseeh College of Engineering and Computer Science used a highway corridor in Portland, Oregon as a case study to evaluate their method, and found that it compared favorably with other methods of evaluating the confidence interval of travel time reliability metrics.
"Traffic engineers can apply this method to come up with a range of estimates for the unknown true travel time reliability metric. The travel time reliability metrics calculated by traffic engineers and transportation planners will have variability due to factors such as road and mode type. The methods proposed in this research can be used to make inferences on travel time reliability metrics which accounts for this variability. Traffic engineers can apply the methods to attach statistical guarantees to the travel time reliability metrics," Unnikrishnan said.
WHY IS IT IMPORTANT?
This research is timely because the COVID-19 pandemic and consequent changes in traffic levels have highlighted the need to quickly compare and better understand the behavior of most commonly used traffic reliability measures.
One challenge for the research team: there is a general lack of consensus on the population distribution of travel times. Depending on the study and the context, a wide variety of distributions have been found to be appropriate. To overcome this difficulty, the researchers developed confidence interval procedures that are general because they are independent of the type of travel time distributions, and can work for a wide range of distribution shapes. This makes the evaluation method more flexible and able to be applied in different situations.
The methods they developed can be used to arrive at practical estimates of changes in traffic, which can help transportation agencies maintain consistent travel times across a roadway network. The outcomes of this project can also help transportation researchers to test other travel time reliability measures, and conduct before-and-after travel time reliability evaluation studies with improved accuracy.
PORTLAND, OREGON CASE STUDY
Next, researchers applied these approaches to a real-world case study. The data for the case study came from the Portland, OR metropolitan region and was originally collected and analyzed as part of an earlier NITC project, Understanding Factors Affecting Arterial Reliability Performance Metrics. In that project, Unnikrishnan worked with PSU civil engineering researchers Sirisha Kothuri and Jason Anderson to understand the temporal variation in travel time reliability metrics on three major arterials in Washington County.
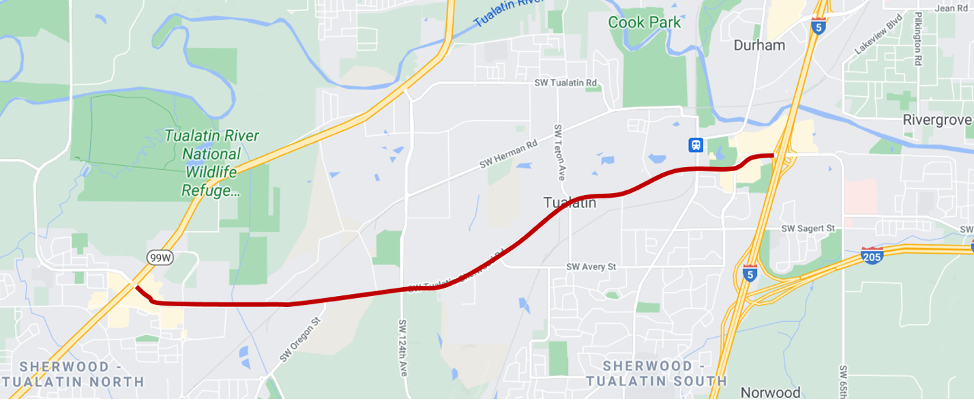
Map of the study corridor; a stretch of Tualatin-Sherwood road from OR 99W to SW Nyberg Street.
Using the data from one of those three arterials—Tualatin-Sherwood Road from OR 99W to SW Nyberg Street—the research team of the current study estimated confidence intervals for three different travel time reliability metrics: buffer index, modified buffer index, and the relative width of travel time distributions.
Where a travel time index is the average additional time required during peak times as compared to times of light traffic, the buffer index represents the additional time that is necessary above the average peak travel time. In this project, researchers considered two forms of buffer index. First, the ratio of 95th percentile travel time to sample average travel time minus one. The modified buffer index refers to the ratio of 95th percentile travel time to median travel time minus one.
The relative width of travel time distributions is defined as the ratio of the range of travel times in which 80% of the observations around the median fall into the median travel time. In another NITC project focused on buses, PSU researchers Travis Glick and Miguel Figliozzi used a similar metric for understanding transit reliability using speed data.
The research team compared their new methods against several existing methods and found that they worked well: Numerical tests showed a positive performance and high statistical power for analyzing the available travel time data. More details about the process can be found in the final report.
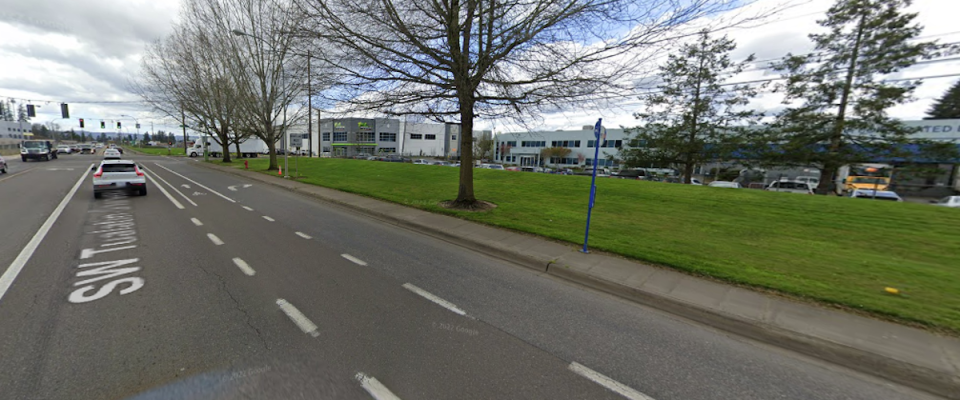
Photo courtesy of Google Streetview
This research was funded by the National Institute for Transportation and Communities, with additional support from the Oregon Department of Transportation.
ABOUT THE PROJECT
RELATED RESEARCH
To learn more about this and other NITC research, sign up for our monthly research newsletter.
- Understanding Factors Affecting Arterial Reliability Performance Metrics
- Data-Driven Mobility Strategies for Multimodal Transportation
- Using High-Resolution Bus Detection Data to Improve Travel Time Prediction and Identify Urban Congestion Spots
The National Institute for Transportation and Communities (NITC) is one of seven U.S. Department of Transportation national university transportation centers. NITC is a program of the Transportation Research and Education Center (TREC) at Portland State University. This PSU-led research partnership also includes the Oregon Institute of Technology, University of Arizona, University of Oregon, University of Texas at Arlington and University of Utah. We pursue our theme — improving mobility of people and goods to build strong communities — through research, education and technology transfer.