Leveraging Twitter and Machine Learning for Real-Time Transit Network Evaluation
- Download the Final Report (PDF)
- Download the Project Brief (PDF)
- Use the STAT Toolbox
- Join the DEMO WEBINAR: STAT will be demonstrated by its creators on Sept 4
With today's profusion of open data sources and real-time feeds, transit agencies have an unparalleled opportunity to leverage large amounts of data to improve transit service. Thanks to NITC researchers, there is now an open-source tool for that.
The new Social-Transportation Analytic Toolbox (STAT) for Transit Networks, developed by NITC researchers in a multi-university collaboration, is a dynamic platform that combines Twitter, general transit feed specification (GTFS), and census transportation planning products (CTPP)—in this case, job density data—to help agencies evaluate overall system performance and identify connectivity gaps. It can also act as a decision support tool for recommending service improvements.
THE SOCIAL-TRANSPORTATION ANALYTIC TOOLBOX (STAT)
The STAT is an open-source, publicly accessible toolbox with three components:
- Temporal distribution of transit stops’ average travel times,
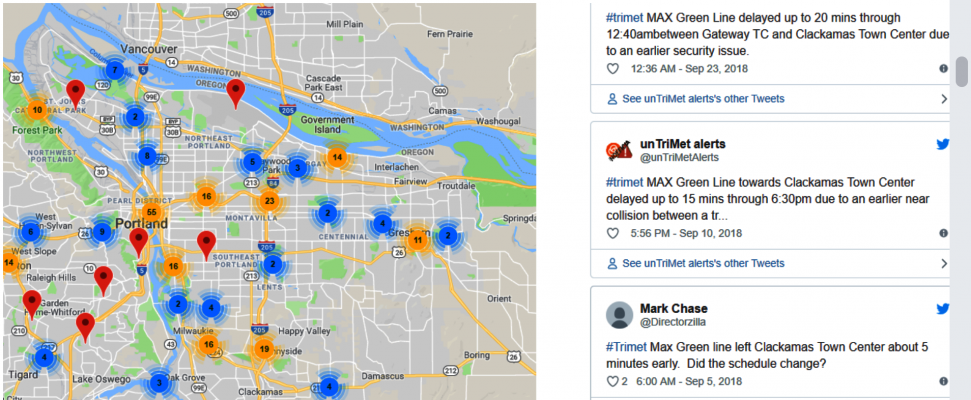
- Transit stop positioning in Google Maps with geomapped tweets around that stop, and
- Overall transit access visualization at the TAZ (traffic analysis zone) level.
The tool is a potential game changer. Agencies usually resort to annual surveys to obtain transit riders’ opinions about service. This is a high-cost, low-resolution method that can reach only a limited sample of transit system users. The STAT tool can help transit providers see a more complete picture of the dynamic and complex interactions between riders and services.
WEIGHTED AVERAGE TRAVEL TIME FOR ALL TIMES OF DAY
Weighted average travel time (WATT), is a transit performance measure that weights travel times (from one stop to all possible stops) based on the attractiveness (potential opportunities) of destinations. In this particular case, travel time is weighted based on job density retrieved from the census data. The major drawback of past studies using WATT is that they all have the same missing piece: the variance in travel times at different times of day. Calculating WATT for all times of day, as this tool does, provides a comprehensive transit accessibility measure that captures the temporal variation in services.
LEVERAGING DATA IN TRANSPORTATION
Forward-thinking transportation analytics has started to realize the advantages of using the explosion of data to manage mobility. For example, the city of Los Angeles partnered with Google Waze to extract information from people using the navigation app and learn where congestion hot spots are. The city also partnered with Esri and developed a geospatial data visualization platform. The High Injury Network project, originating in San Francisco, maps a city’s pedestrian and cyclist fatalities related to traffic incidents to identify risk factors and prevention strategies. Researcher Lisa Schweitzer of the USC Price School of Public Policy used Twitter in an award-winning paper analyzing stigma around public transit.
These advancements support agencies in improving traffic management and operations, and help the general public to better understand their local environment. More importantly, they inform evidence-based and data-driven decision-making in transportation policy and investment choices.
Social media has been leveraged in a myriad of studies for insights into travel demand estimation, mobility behavior assessment, traffic condition monitoring, and incidents and natural disasters modeling. However, only a few studies to date have used social media information for public transit analysis, mostly focusing on sentiment analysis to evaluate transit system performance from transit riders’ perspectives.
PROOF OF CONCEPT AND NEXT STEPS
This project began as a proof of concept, as researchers sought to facilitate the use and integration of new, open transportation data for transit agencies in discovering and strengthening fundamental patterns of interactions between users and transit services. The ultimate goal is to provide a rich analytical platform to enable transit agencies to effectively explore insights from the integrated transportation data.
The researchers engaged two transit agencies, the Utah Transit Authority (UTA) and TriMet, to test the usability of the toolbox. Salt Lake City, Utah and Portland, Oregon were used as case studies in the platform for querying, navigating and exploring the interactions between transit users and services.
Leveraging machine learning and natural language processing techniques, the team retrieved Twitter data that are related to public transit systems and extracted sentence structures to geomap those tweets to their corresponding transit lines/stations. Combined with transit accessibility measures computed using GTFS, the tool enables us to identify the mismatch between the services the agency is providing versus what the transit users are experiencing.
The future goals for STAT's development include:
- Incorporating data from additional social media platforms like Facebook and Instagram,
- Including more transit agencies to reach other cities besides Portland and Salt Lake City,
- Adding more data sources, such as GTFS Realtime and GPS-based transit location trackers.
A webinar on September 4, 2019 will demonstrate the STAT toolbox for the primary purpose of getting feedback from transit agencies on the tool's usefulness. The researchers are especially interested in hearing about any improvements that would aid transit agencies in implementing it. Register here for the webinar.
THE RESEARCH TEAM
University of Utah: Xiaoyue Cathy Liu (Principal Investigator), Qian Zuo and Shenruoyang Na
University of California, Riverside: Ran Wei
Portland State University: Aaron Golub, Liming Wang and Jake Davis
MULTIMODAL DATA AT TCS 2019 (PORTLAND, OR)
NITC is working to improve the usefulness of transportation data on many fronts, in recognition of the fact that emerging data sources have the power to change lives. To that end, the 11th annual Transportation and Communities Summit will feature a multimodal data track focused on solutions for counting underrepresented travelers and ensuring an equity-informed approach to representation, while the keynote address, Shaping a City with Open Data, will be delivered by Ben Wellington, the data analyst behind I Quant NY.
This research was funded by the National Institute for Transportation and Communities, with additional support from Portland State University and the University of Utah.
RELATED RESEARCH
To learn more about this and other NITC research, sign up for our monthly research newsletter.
- Overcoming Barriers for the Wide-scale Adoption of Standardized Real-time Transit Information
- Measuring the Impacts of Social Media on Advancing Public Transit
- SEGMENT: Applicability of an Existing Segmentation Technique to TDM Social Marketing Campaigns in the United States
- Ecological Momentary Assessment Methods
- (Explore more data-focused NITC projects here.)
The National Institute for Transportation and Communities (NITC) is one of seven U.S. Department of Transportation national university transportation centers. NITC is a program of the Transportation Research and Education Center (TREC) at Portland State University. This PSU-led research partnership also includes the Oregon Institute of Technology, University of Arizona, University of Oregon, University of Texas at Arlington and University of Utah. We pursue our theme — improving mobility of people and goods to build strong communities — through research, education and technology transfer.