Watch video
View slides
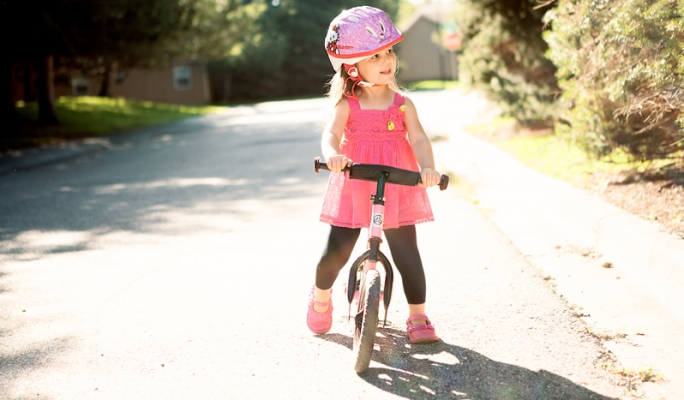
In the U.S., women are far less likely to bicycle for transportation than men. Explanations include, among others, safety concerns (traffic and crime), complex travel patterns related to household responsibilities, time constraints, lack of facilities that feel safe, and attitudes. This talk will explore how this gender gap emerges in childhood, using data from the Family Activity Study. The study collected data from 300 Portland families (parents and children) over two years, allowing us to see how things change over time.
Jennifer Dill is a Portland State University professor and the director of TREC. She teaches courses in transportation policy, pedestrian and bicycle planning, and research methods. Her research interests focus on the interactions of transportation planning, travel behavior, health, the environment and land use. In general, she is interested in answering these questions: How do people make their travel and location decisions? How do those decisions impact the environment? How do our planning decisions impact people's travel and location decisions? Prior to entering academia, she worked as an environmental and transportation planner.