Bus Stops Improvements Along Utah Corridor Increase Ridership and ADA Accessibility

A bus stop can be anything from a simple signpost stuck in the grass, to a comfortable shelter with seating and paved access to the sidewalk. For many U.S. transit agencies across the country, improving facilities at bus stops is a priority. But how much do these improvements actually affect ridership? A lot, it turns out. A new NITC study, co-funded by the Utah Transit Authority (UTA) and led by Keith Bartholomew of the University of Utah, found a 5.9% increase in boardings after improvements were made to a series of bus stops in Salt Lake City - compared to only a 1.7% overall increase in boarding at stops in a control group that were not improved.
The bus stop improvements – which include adding shelters and seating as well as stronger compliance with the Americans with Disabilities Act (ADA) – also correlated with a decrease in ADA paratransit demand in the area. These two results—increased boardings on scheduled-service buses and reductions in paratransit use—suggest that perhaps some ADA paratransit riders were switching to scheduled-bus service for at least some of their trips. To test this possibility, the team assessed how often buses were deploying their wheelchair ramps. They found that increased ramp deployments were, in fact, significantly associated with bus stops that had been improved. They found similar results in the usage of Freedom Access Passes – a pass issued to Utah patrons who qualify for ADA paratransit service, which allows them to use scheduled bus service for free. The use of Freedom Access Passes increased significantly at stops that UTA had improved. In short, if you build it - they will come.
The changes in ADA paratransit demand, however, were much smaller in magnitude than the overall change in bus stop boardings: In other words, the data suggest that improved stops are appealing to riders of all abilities, not just those who qualify for ADA paratransit.
THE ROLE OF BUS STOPS: FIRST POINT OF CONTACT
A bus stop functions as the point of first contact between the transit operator and the customer. To a potential rider, the characteristics of the stop sends signals about how the agency sees itself and the value of its product. What do the various physical components of the stop communicate about the quality of the transit services being offered? If the features of the stop project an image of a bare-bones, minimal-investment style of service, that image is likely to be adopted by the riding public. If a bus stop offers a place of shelter and rest, the message is one of hospitality; that the transit agency cares about the rider's comfort.
To someone who uses a mobility device such as a wheelchair, a stop with a concrete pad connected to the surrounding sidewalk network indicates the agency’s intention to welcome such riders. The stop with no pad implicitly sends a message that such riders are not accommodated. Intended or not, this can send a message of callousness or indifference on the part of the agency.
QUANTIFYING THE BEFORE-AND-AFTER IMPACTS ON SALT LAKE CITY RIDERSHIP
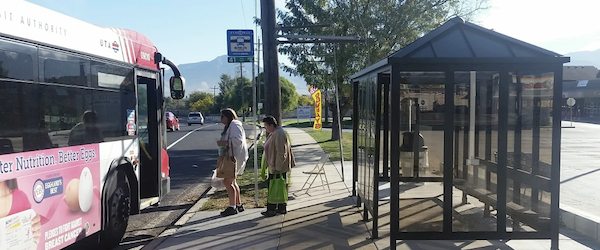
When choosing which stops to improve, transit agencies often use a scatter-shot approach. But in 2014 the UTA elected to upgrade a series of stops along a specific route – the number 41 bus line in Salt Lake City – in hopes that strategically improving the corridor would have a bigger impact on customer satisfaction and ridership. The upgrades included creating ADA-compliant concrete pads, connecting those pads to surrounding sidewalk networks, and installing a variety of fixtures, including trash cans, benches, shelters, and (at a grocery store) a shopping cart corral.
This image shows before and after bus stop facility improvements along the #41 bus line:
The researchers' objective was to analyze stop-level boarding data along this corridor to determine whether, and the degree to which, the investments might be associated with changes in both stop-level boardings and demand for ADA paratransit.
Researchers compared data from January to June of 2014 (before improvements) and the same six-month period in 2015 (after). As a control group, they also compared the same time period for stops further along the #41 route that were not improved.
To investigate possible impacts on ADA paratransit demand, the research team geocoded all paratransit deployment locations (i.e., the origins of individual riders’ trips) and selected those trips that began within a quarter-mile buffer surrounding both the treatment group and control group stops.
This analysis revealed that the sum of the scheduled-service boardings for treatment group stops was 5.9% higher in the after period than it was in the before period. Boardings at stops in the control group, by contrast, showed only a 1.7% overall increase in ridership between the same periods. Meanwhile, the team observed that paratransit deployments in the buffer areas around the control group stops decreased by 9% between the before and after periods.
For greater statistical rigor, the team went on to use a number of quantitative techniques, including propensity score matching and propensity score weighting.
QUALITATIVE APPROACH: INTERVIEWS AND FOCUS GROUPS
To better understand the importance of making bus stop improvements, the team conducted qualitative investigations with three distinct groups of people:
- UTA riders who have identified themselves as having disabilities that impact their mobility,
- UTA personnel involved in providing service to riders with disabilities, and
- advocates for such riders.
The team’s qualitative work is still ongoing. Over the next nine months the researchers expect to interview national-level planners, agency personnel, and advocates to gain further insights. Here are some of the preliminary themes that are emerging from the data:
Bus Shelters
Several of the participants indicated support for the construction of more shelters at bus stops, especially for protection against extreme weather.
“I would like to see more of the bus stops . . . during the summer have canopies over them so the sun’s not beating down on it. You know because here in Utah, it can get very, very hot. And I know some [of the stops] do. But even when it snows . . . it would be nice just to keep the snow off of it.”
“My perfectly designed bus stop ... would be a bus shelter with a bench. It would have on that shelter somewhere a push button or a sign or something in tactile numbers that would state what number bus stop you are at. Because they have a system . . . where you can call and if you know what bus stop you are at, you can . . . find out when the next bus is supposed to be there. I suppose that system works wonderfully [for sighted riders], but I can never know because . . . whenever I find a bus stop, there is no numbered sign or anything to tell me which bus [stop] it is.”
Pedestrian Access
A number of participants identified the lack of other features in the right-of-way that impeded use of buses, particularly the lack of sidewalks and curb cuts. In places with sidewalks, many participants noted concern about inconsistent snow removal in winter months which effectively barrs access to bus stops.
“Where I live . . . there's no sidewalks where the bus stops are... You're on grass. You're on nothing. If you use a wheelchair, how are you going to get yourself to whatever?”
Other Design Issues: Where Do I Sit or Stand?
A recurring issue raised by a number of participants in the focus groups and interviews is knowing where to physically situate oneself while waiting for the bus. This issue was particularly voiced by riders with vision impairments. Without a consistent protocol for specifying precisely where a bus “docks” in relation to the other features of a bus stop (e.g., the pole or the shelter) it is challenging for riders to know whether or not they are waiting in a location where the bus pulls up, the bus arrives, opens its door, and then leaves before the rider has a chance to board.
This worry, in fact, undercuts the utility of shelters, at least with some riders. If one is worried that the bus operator might not see the rider waiting in the shelter, the rider is unlikely to wait inside the shelter.
Accessible Information
Auditory signals and stop announcements are another area of concern, again primarily for riders with impaired vision. Riders in the focus groups and interviews listed a number of points at which better auditory signals are needed, including exterior announcements as a bus pulls up identifying the bus’s route number and name, and interior announcements identifying upcoming stops.
Cost and Geography
Another overarching concern for riders with disabilities is the cost of transit services, particularly for ADA paratransit. The current user-cost for using ADA paratransit is $4.00 per one-way ride; a significant burden for a number of the riders involved in our focus groups and interviews. Conversely, riding the bus with Freedom Access Pass on scheduled bus service for free would eliminate that burden, if that bus service was accessible.
A related issue is the limit in geographic coverage of allowed pick-up services for ADA paratransit. As allowed by federal regulations, UTA limits paratransit service to those areas that are within three-quarters of a mile of scheduled-service routes. As one rider noted, this “limits where people can live in the community. It limits where they can recreate. That limits a lot of their life.” Where people can live is further limited by available options in accessible housing.
WHAT'S NEXT?
As noted above, the research team is still working to collect qualitative data, a task made more difficult by the COVID-19 pandemic. Because of these challenges, the team will be focusing its work on conducting structured interviews with planners working for Utah municipalities with agency staff at the Utah Department of Transportation and the U.S. Department of Transportation. It is hoped that this additional data will facilitate more in-depth analysis that can shed further light on how the features of bus stops can operate to increase riders’ accessibility to opportunities in their communities.
This research was funded by the National Institute for Transportation and Communities and the Utah Department of Transportation.
RELATED RESEARCH
To learn more about this and other NITC research, sign up for our monthly research newsletter.
The National Institute for Transportation and Communities (NITC) is one of seven U.S. Department of Transportation national university transportation centers. NITC is a program of the Transportation Research and Education Center (TREC) at Portland State University. This PSU-led research partnership also includes the Oregon Institute of Technology, University of Arizona, University of Oregon, University of Texas at Arlington and University of Utah. We pursue our theme — improving mobility of people and goods to build strong communities — through research, education and technology transfer.
