")
If you weren’t one of the 10,000 people who attended the Transportation Research Board’s Annual Meeting in January, there are fifty students and twenty faculty for PSU, UO, OSU and OIT who can tell you what they learned there. OTREC's bright yellow lanyards made our presence especially visible! PSU student Brian Davis blogged about his experience, OTREC’s Jon Makler was interviewed in a local newspaper, and the Oregon “delegation” at the conference was covered by both local and national blogs. Team OTREC filed some daily debriefs, highlighting presentations on topics such as federal stimulus investments in Los Angeles and Vermont’s efforts to address their transportation workforce crisis with returning military veterans (as well as the...
Read moreThe video begins at 3:38.
View slides
Summary: Shaun will present on the recently completed pilot demonstration of multimodal arterial performance measures for the Portland metro region, as part of the larger regional concept of operations. Treatments include a permanent bike count station on the Springwater Trail, permanent truck classification stations, Bluetooth travel time stations, as well as leveraging existing transit and signal controller data to paint a picture of the collective modal transportation system.
Bio: Shaun Quayle is a transportation engineer with Kittelson and Associates, Inc. (www.kittelson.com). His focus areas of practice are in the operations, planning and design of arterial traffic signal systems, performance management systems, and complex traffic analysis and simulation.
The video begins at 1:48.
A System-Wide Adaptive Ramp Metering (SWARM) system is being implemented in the Portland metropolitan area and should be operational on all corridors by April 2006. This study entails a before and after evaluation of the operational benefits of the new SWARM system using the existing data, surveillance and communications infrastructure. In particular, the study will quantify system-wide benefits in terms of savings in delay, emissions and fuel consumption and safety improvements on and off the freeway due to the implementation of the ramp metering system. This will aid in the optimal deployment of current SWARM system and will be transferable to other regions as their systems come on line in the future.
Watch video
View slides
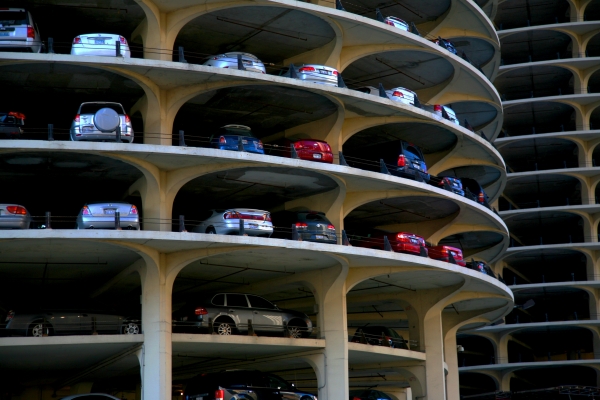
SFpark was a federally-funded pilot program of a new approach to managing parking in San Francisco. It utilized real time data to identify parking availability, and demand-responsive parking pricing to help make parking easier to find. Parking management is an invaluable transportation demand management tool and the SFpark pilot demonstrated how data can help cities make smarter decisions. Come hear about the pilot evaluation results from a former SFpark staffer and PSU alum.
Kathryn Doherty-Chapman is a transportation planner focused on helping people access safe and healthy transportation options.... Read more
View slides
Watch video:
New technologies such as smart phones and web applications constantly collect data on individuals' trip-making and travel patterns. Efforts at using these "Big data" products, to date, have focused on using them to expand or inform traditional travel demand modeling frameworks; however, it is worth considering if a new framework built to maximize the strengths of big data would be more useful to policy makers and planners.
In this presentation Greg Macfarlane will present a...
Read more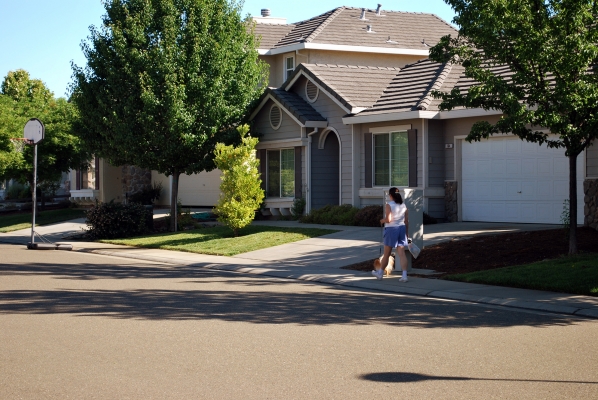
Watch video
View slides
Topic: Understanding Where We Live and How We Travel: The Development of an Online Visual Survey Tool and Pilot Studies Evaluating Preferences in Residential Neighborhood Choice and Commute
Summary: Understanding changing residential preferences—especially as they are represented within land use and travel demand models—is fundamental to understanding the drivers of future housing, land use and transportation policies. As communities struggle to address a rising number of social challenges with increasing economic uncertainty, transportation and land use planning have become increasingly centered on assumptions concerning the market for residential environments and travel choices. In response, an added importance has been placed on the development of toolkits capable of providing a robust and flexible understanding of how differing assumptions contribute to a set of planning scenarios and impact future residential location decisions.
In this presentation, we discuss one such improvement that can be added to the transportation planning toolkit: an innovative visual online survey tool. This tool was developed to provide a means for researchers to communicate the residential environment to the public. Within this study, we test the ability for the...
Read moreThe video begins at 2:34.
View slides
Other presentation materials: Handout (PDF)
Summary: The recent City Club report on bicycling provided an opportunity to collect and analyze a number of data sets including the new Hawthorne Bridge data. One question is where Portland bicycling on the logistic curve -- a common tool for judging the maturity of a developing product or activity. Logistic curves are used for marketing, for epidemiology, and even for visits to Indian owned casinos. The preliminary evidence is that we are reaching the horizontal area of the curve. Additional evidence Our further research into future policies indicates a shift to bicycle boulevards in order to attract more risk averse riders.
Bio: Robert McCullough is an energy economist (and an adjunct at PSU) who has written, talked, and testified on energy issues across the U.S. and Canada. He was instrumental in the identification and prosecution of Enron's energy traders. He also works with aboriginal groups in Quebec and Oregon, activists in California and Ohio, as well as many others. His most recent project is the economic review of the WNP-2 nuclear station for Physicians for Social...
Read more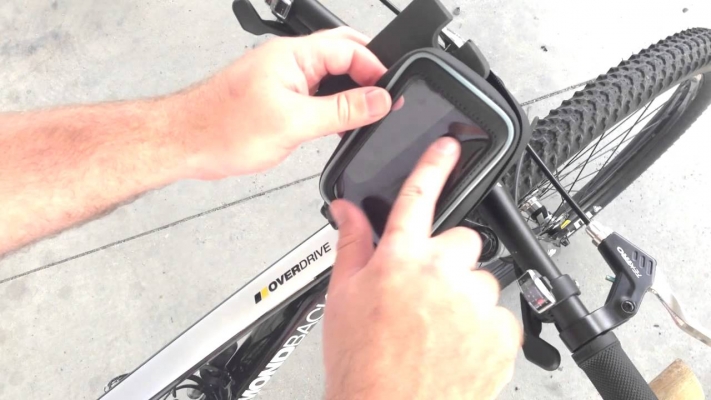
Watch video
View slides
ORcycle is a new smartphone application (for both Android and iOS) developed by Transportation, Technology, and People (TTP) lab researchers at Portland State University as part of an Oregon Department of Transportation (ODOT) research project. ORcycle collects user, route, infrastructure, crash, and safety data. ORcycle was successfully launched in early November 2014 and presents many improvements over existing or similar apps. Initial data findings and insights will be presented. Lessons learned as well as opportunities and challenges associated with smartphone data collection methods will be discussed. More information about the app can be found here: http://www.pdx.edu/transportation-lab/orcycle
Read more
Watch video
View slides
Where: Room 204 of the Distance Learning Center Wing of the Urban Center at PSU
The ability to forecast future transportation patterns under a particular land-use scenario or urban form is key to making informed decisions at the local and regional levels.
Although several researchers have explored the links between the built environment, socio-demographics and travel behavior, a consensus is not reached.
This talk highlights two recent projects. The first project focuses on individuals’ attitudes towards transportation, neighborhood characteristics and their effects on campus commuters’ transit use, and addresses the question whether attitudes, the built environment or a combination of both explains the resulting transit use better.
The second part presents the Regional Land Use Allocation Decision Analysis Tool developed for The Ohio Department of Transportation, which enables decision makers to quantify the impacts of population and employment distribution in terms of the resulting VMT (Vehicle Miles Traveled). This tool forecasts the impacts of future land-use policies in Ohio, based on alternative assumptions of highway and mass transit corridor development, zoning and environmental constraints, regional growth or decline...
Read more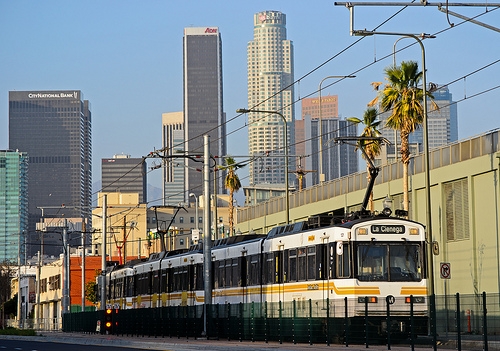
The video begins at 2:25.
View slides
Topic: Using "big data" for transportation analysis: A case study of the LA Metro Expo Line
Summary: Access to a comprehensive historical archive of real-time, multi-modal multi-agency transportation system data has provided a unique opportunity to demonstrate how “big data” can be used for policy analysis, and to offer new insights for planning scholarship and practice. We illustrate with a case study of a new rail transit line. We use transit, freeway, and arterial data of high spatial and temporal resolution to examine transportation system performance impacts of the Exposition (Expo) light rail line (Phase 1) in Los Angeles. Using a quasi-experimental research design, we explore whether the Expo Line has had a significant impact on transit ridership, freeway traffic, and arterial traffic within the corridor it serves. Our results suggest a net increase in transit ridership, but few effects on traffic system performance. Given the latent travel demand in this heavily congested corridor, results are consistent with expectations. The benefits of rail transit investments are in increasing transit accessibility and person throughput within high-demand corridors; effects on roadway traffic are small and localized.
Bio: Mohja Rhoads...
Read more