The video begins at 2:15.

View slides

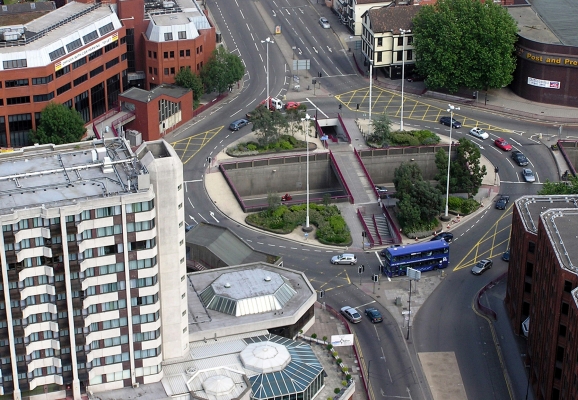
Abstract: TriMet has used a computer aided dispatch (CAD)/automatic vehicle location (AVL) system to manage bus and rail operations since the late 1990s. TriMet is currently in the process of updating the CAD/AVL system, and anticipates improvements in bus tracking and performance monitoring. This presentation will show how TriMet uses data from the system to support intelligent transportation systems (ITS) such as TransitTracker and automatic stop announcements in buses and trains, as well as to analyze transit operations such as on time performance and passenger loads.

Speaker Bios: Steve Callas is the Manager of Service and Performance Analysis at TriMet in Portland Oregon, where he is responsible for operations performance monitoring and analysis. This includes analyzing TriMet’s comprehensive automatic vehicle location and automatic passenger counter data archive. Additionally, Steve is involved in various transit operations research projection in conjunction with Portland State University and OTREC. Steve has been with TriMet for over 15 years.

David is an operations analyst with TriMet. He is involved in AVL data mining and analysis, safety analysis, automatic stop announcements, transit signal priority, and real-time...

Read more

PORTAL: Lessons from Developing an Archived Data User Service in Portland, Oregon

The video begins at 0:23.

Watch video

View slides

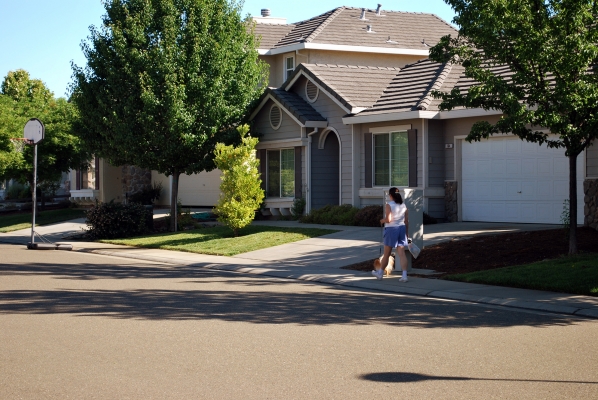
Summary: Researchers from the transportation, planning and health fields share the common goal of promoting physically active lifestyle. One challenge that researchers often face is the measurement of physical activity, particularly among children. This is because the sporadic nature of children’s physical activity patterns makes it difficult to recall and quantify such activities. Additionally, children’s lower cognitive functioning compared to adults prevents them from accurately recalling their activities. This presentation will describe the design and application of a novel self-report instrument - the Graphs for Recalling Activity Time (GReAT) - for measuring children’s activity time use patterns. The instrument was applied in a study of children’s risk for obesity and diabetes in a predominately Hispanic community in Milwaukee, WI. Time-use data for two weekdays and one weekend day were collected for various physical and sedentary activities. The data was then assessed against measurements of the children’s cardiovascular fitness, weight status and insulin resistance through exploratory analysis and structured equation modeling. Findings on GReAT’s reliability and new evidence on the impacts of time-use in different activities on children’s risk for...

Read more

The video begins at 1:55.

View slides

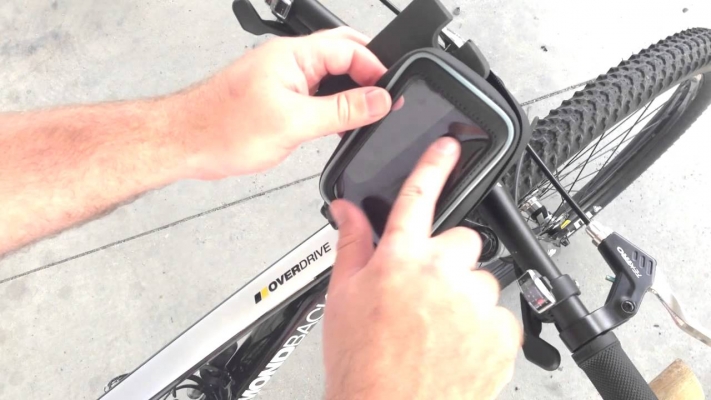
Abstract: Traffic counts are an important piece of information used by transportation planners; however, while count programs are common for motor vehicles most efforts at counting non-motorized traffic – cyclists and pedestrians – are minimal. Long-term, continuous counts of non-motorized traffic can be used to estimate month of year and day of week adjustment factors that can be used to scale short-duration counts to estimates of annual average daily traffic. Here we present results from continuous counts of non-motorized traffic at 6 locations on off-street trails in Minneapolis, MN using two types of automated counters (active infrared and inductive loop detectors). We found that traffic volumes varied significantly by location, but the month of year and day of week patterns were mostly consistent across locations and mode (i.e., cycling, walking, or mixed mode). We give examples of how this information could be used to extrapolate short-duration counts to estimates of annual average daily traffic as well as Bicycle Miles Traveled (BMT) and Pedestrian Miles Traveled (PMT) for defined lengths of off-street trails. More research is needed to determine if non-motorized traffic patterns (and subsequently our adjustment factors) for off-street...

Read more

View slides

The video begins at 3:11.

This summer we're hosting a two-part data science course. You can register for one or the other– or attend both parts at a discount: Data Science Course 2018, Part 2: Intermediate/Advanced Scientific Computing for Planners, Engineers, and Scientists.

----

CLICK HERE TO REGISTER

Did you ever feel you are “drinking from a hose” with the amount of data you are attempting to analyze? Have you been frustrated with the tedious steps in your data processing and analysis process and thinking, “There’s gotta be a better way to do things”? Are you curious what the buzz of data science is about? If any of your answers are yes, then this course is for you.

Classes will all be hands-on sessions with lecture, discussions and labs. Participants can choose to sign up for one or both courses. For more information, ...

Read more

Pages