
The video begins at 5:31.
Watch video
View slides
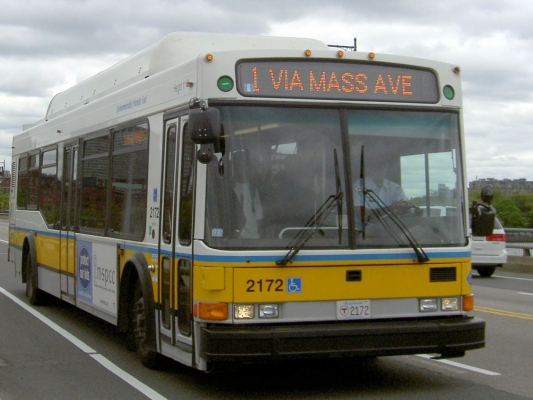
This webinar presents a novel method that utilizes location-based services for collecting public transportation data.
A NITC-funded project at the University of Oregon will be presented that focuses on the development and evaluation of a mobile application based on Bluetooth low energy technology sensors and geofencing technology for crowdsourcing data collection.
The application was employed in a case study using Lane Transit District’s express bus system in the Eugene-Springfield area in western Oregon. The results show that using these types of location-based services offers an effective approach to collecting richer data than traditional means, while requiring only minimal...
Read more
This summer we're hosting a two-part data science course. You can register for one or the other– or attend both parts at a discount: Data Science Course 2018, Part 1: Introduction to Scientific Computing for Planners, Engineers, and Scientists
----
Did you ever feel you are “drinking from a hose” with the amount of data you are attempting to analyze? Have you been frustrated with the tedious steps in your data processing and analysis process and thinking, “There’s gotta be a better way to do things”? Are you curious what the buzz of data science is about? If any of your answers are yes, then this course is for you.
Classes will all be hands-on sessions with lecture, discussions and labs. Participants can choose to sign up for one or both courses. For more information, download the...
Read moreWatch video
View slides
Summary: Linking planning and operations is vital to improving transportation decision making and the overall effectiveness of transportation systems. In this seminar Steve will discuss data and modeling methods supported by the PTV Vision software suite to facilitate integrated planning for operations.
Bio: PSU Alum Steve Perone is the President of PTV America, Inc. the North American subsidiary of German software provider PTV Group. Headquartered in Portland, Oregon he is responsible for supporting a diverse customer base of traffic engineers and transportation planners from over 1,000 public agencies, universities and consulting firms combined. His experience draws on time spent in roles as both a public sector employee and as a private consultant supporting public agencies. In his role he actively supports many ITE and TRB events and programs.
The video begins at 2:51.
Adam Moore: Bus Stop Air Quality: An Empirical Analysis of Exposure to Particulate Matter at Bus Stop Shelters
Congested traffic corridors in dense urban areas are key contributors to the degradation of urban air quality. While waiting at bus stops, transit patrons may be exposed to greater amounts of vehicle-based pollution, including particulate matter, due to their proximity to the roadway. Current guidelines for the location and design of bus stops do not take into account air quality or exposure considerations. This study compares the exposure of transit riders waiting at three-sided bus stop shelters that either: 1) face the roadway traffic or 2) face away from the roadway traffic. Shelters were instrumented with air quality monitoring equipment, sonic anemometers, and vehicle counters. Data were collected for two days at three shelters during both the morning and afternoon peak periods. Bus shelter orientation is found to significantly affect concentration of four sizes of particulate matter: ultrafine particles, PM1, PM2.5, and PM10. Shelters with an opening oriented towards the roadway were consistently observed to have higher concentrations inside the shelter than outside the shelter. In contrast, shelters oriented away from the roadway were observed to have lower concentrations inside the shelter than outside the shelter. The differences in particulate matter...
Read more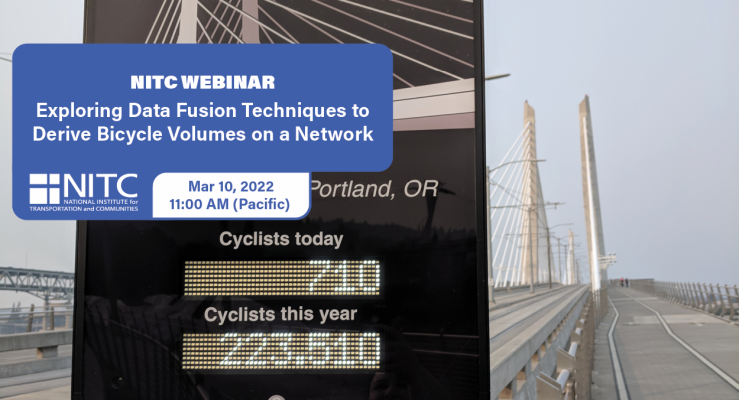
PRESENTATION ARCHIVE
OVERVIEW
Planners and decision makers have increasingly voiced a need for network-wide estimates of bicycling activity. Such volume estimates have for decades informed motorized planning and analysis but have only recently become feasible for non-motorized travel modes.
Recently, new sources of bicycling activity data have emerged such as Strava, Streetlight, and GPS-enabled bike share systems. These emerging data sources have potential advantages as a complement to traditional count data, and have even been proposed as replacements for such data, since they are collected continuously and for larger portions of local bicycle networks. However, the representativeness of these new data sources has been questioned, and their suitability for producing bicycle volume estimates has yet to...
Read moreThe video begins at 0:39.
View slides
Summary: This presentation is a showcase of various GIS tools developed for bicycle network analysis and planning. The showcase includes a tool for assessing community-wide bikeability, a tool for forecasting bicycle volumes based on street topology, and a tool for evaluating different bicycle improvement plans in terms of exposure to danger situations for bicyclists. The tools will be demonstrated with case study data. The presentation will include a review of the Highway Capacity Manual Bicycle Level of Service and a discussion about using bicycle and pedestrian data collected through citizen-volunteer count programs.
Bio: Dr. Michael Lowry holds a joint appointment in Civil Engineering and Bioregional Planning at the University of Idaho. He is an affiliate researcher for the National Institute for Advanced Transportation Technology. His research focuses on capital investment decision-making and transportation planning for bicyclists and pedestrians. Dr. Lowry teaches courses related to sustainable transportation, engineering statistics, and economic analysis. He received his PhD in Civil and Environmental Engineering from the University of Washington and BS and MS from Brigham Young University.
The video begins at 2:26.
Abstract: This report offers a new view of urban transportation performance. It explores the key role that land use and variations in travel distances play in determining how long Americans spend in peak hour travel. It shows how the key tool contained in the Urban Mobility Report – the Travel Time Index – actually penalizes cities that have shorter travel distances and conceals the additional burden caused by longer trips in sprawling metropolitan areas. Finally, it critically examines the reliability and usefulness of the methodology used in the Urban Mobility Report, finding it does not accurately estimate travel speeds, it exaggerates travel delays, and it overestimates the fuel consumption associated with urban travel. How we measure transportation systems matters, and the nation needs a better set of measures than it has today.