Transit Impacts on Jobs, People and Real Estate: Where People Live

The latest report funded by the National Institute for Transportation and Communities – Transit Impacts on Jobs, People and Real Estate, from the University of Arizona – represents the culmination of nearly a decade of research into the economic effects of transit. To unpack the dense and substantial findings from 17 LRT, 14 BRT, 9 SCT, and 12 CRT systems in 35 metro areas across the United States, we're telling the story in chapters. Last month we focused on how transit impacts the locations of jobs.
Now we're taking a deeper dive into volume 3 of the final report: Impact on Where People Live Over Time with Respect to Transit Station Proximity Considering Race/Ethnicity and Household Type and Household Budget by Transit Mode and Place Typology with Implications for Transit and Land Use Planning (PDF).
HOW DOES TRANSIT IMPACT WHERE PEOPLE LIVE?
By the year 2050, America is projected to gain at least 100 million new residents, 40 million new households, and 60 million new jobs. Demographic analysis and consumer preference surveys tell us that at least a third of America’s 150 million households (50+ million) in 2050 will want to live in locations providing them with transit options. Volume 3 of this report explores how transit station proximity affects the location of households over time, looking at:
- Race/Ethnicity
- Householder age
- Household type:
- Household with children
- 2 or more adults without children
- Single-person household
- Commute mode
The analysis advances our understanding of how transit stations affect the pattern of household residence in a multimodal transportation system context, how commuters respond to transit proximity, what transportation modes seem to complement each other, and what demographics may be in competition for transit station proximity.
PLACE TYPES AND TRANSIT TYPES
Results of the analysis are presented according to the type of place and type of transit being examined. Researchers looked at four types of fixed-route transit systems:
- Bus Rapid Transit (BRT)
Commuter Rail Transit (CRT) - Light Rail Transit (LRT)
- Streetcar Transit (SCT)
Places are divided places into four types based on their Mixed-Use/Accessibility (abbreviated to MA). Mixed-use refers to the variety of land uses, while accessibility refers to walkability and ease of access to transit. See Volume 1 (PDF) for more details on this Place Typology, which plays a key role in the analysis:
- High-MA
- Moderate-MA
- Low-MA
- Poor-MA
HOUSEHOLDS AND COMMUTING CHOICE
People respond to transit proximity in their housing and commuting choices very differently depending upon the local context. Chapter 5 of Volume 3 is devoted to examining the links between transit station proximity and place type with changes in households, housing tenure and commuting choice over time. Relative to the counties within which transit systems operate, are there shifts in the regional share of people and housing over time with respect to fixed-route transit station proximity? The research took a closer look at:
- Households by age,
- Households by commuting choice,
- Households by type and tenure
The report offers comprehensive results for each type of transit and each place type, but two key findings:
Each population segment responded differently at different transit stops by transit mode and place type. However, there are results that hold true across most of the mode/place type categories. For example, walking, biking, transit use, and working from home increased in most of these locations and categories.
For most transit modes, the Poor-MA place type repelled residents, in varying degrees, from the direct vicinity of the station. In many cases, residential growth was evident just beyond the station, mostly within the first half-mile radius of distance from the station.
IMPLICATIONS FOR TRANSIT AND LAND USE PLANNING
One important takeaway from this study for planners is the classification of transit stations into attractors and repellants – by transit mode and place type, and for whom, and at what distance from the transit station (many households are repelled from the station at the first distance band, 0.125 miles away). This information can help planners better predict where people will live in relation to different types of transit stations.
There are indications of competition and synergy between households by size and age, housing tenure and commuting choice. There is also increasing evidence that households with children are being attracted to many transit stations by mode and place type. This is contrary to traditional wisdom.
Another unexpected trend is the rising popularity of “other” transportation modes at the stations. This indicates that the market is responding in significant ways to new modes that may include bike share and e-scooters.
Those demographic segments that grew faster than the regional trend, or faster than the station area's total population, highlight important market responses to transit proximity and may help policy makers determine the relative change in importance over time of being connected to transit stations, for those specific segments of the population.
PEOPLE AND DEMOGRAPHIC CHANGES
Chapter 7 of the report is dedicated to examining the link between transit station proximity and typology and the change in people by demographic groups over time. Demographic change is evaluated as an important result of the makeup of the transportation system, and particularly the effects of transit stations on the changing aspects of demographic concentrations across the landscape.
Some basic trends became evident across the place type/transit mode combinations (see the report for more complete data tables):
- Black populations declined near most stations by transit mode and place type.
- White populations saw mostly modest to robust growth in most stations by mode and place type.
- Hispanic populations saw a range of growth and decline, with many examples of growth being confined mainly to the station area.
IMPLICATIONS FOR TRANSIT AND LAND USE PLANNING
There is some competitive sorting between these population segments, but perhaps the strongest influence on these patterns are these elements - which vary greatly between metropolitan areas:
- the underlying locations of jobs most held by each group,
- the part of the city most inhabited by each group, and
- the kind of housing each group usually occupies.
These findings support policies that more equitably distribute these patterns, such as zoning for a wider range of housing across the metropolitan area, and provision of transit system extensions into less-served areas of regions.
TRANSPORTATION COSTS
In their analysis of transportation costs, the research team focused on proximity to Light Rail Transit (LRT) stations. They evaluated the relationships between station proximity and median household transportation costs, and found that households that were closer to LRT stations had lower transportation costs.
Unsurprisingly, social equity issues arise from this association: higher-income households are better able to compete for locations near transit stations, because they can more easily afford the higher housing prices and rents that come along with the transportation costs savings.
Researchers also found important differences in transportation costs incurred by different households with respect to the type of urban place in which they live. Compared to Poor-Mixed Use/Accessibility areas, households in High-, Moderate- and Low-MA areas incurred fewer vehicle miles traveled (VMT). Moreover, the higher the degree of mixed use and accessibility, the lower the VMT. This was a trend seen across all household types.
In essence, there can be considerable transportation cost savings when locating near LRT stations -- and especially when also locating in High MA areas -- but these savings are generally available only to higher-income households.
IMPLICATIONS FOR TRANSIT AND LAND USE PLANNING
The researchers suggest that interventions may be needed to make it possible for some households who wish to locate near transit and in higher MA areas but cannot compete with other households. To this end, local and state governments may need to expand the supply of deeply subsidized affordable housing in location-efficient areas. Nelson estimates that about a quarter of American households want to live near fixed guideway transit opportunities, though less than 10 percent have those options now.
ABOUT THE PROJECT
- Download the Full Final Report (All 5 volumes in one PDF)
- Download the two-page Project Briefs:
- Volume 2 (PDF)
- Volume 3 (PDF)
- Volume 4 (coming soon - July)
- Volume 5 (coming soon - August)
- Watch the recorded webinar from March 23, 2021
The final report is presented in five volumes, with the first volume serving as an orientation and introduction:
- Volume 1: Orientation, Executive Summary, Context and Place Typologies (PDF)
- Volume 2: Impact on Job Location Over Time with Respect to Transit Station Proximity Considering Economic Groups by Transit Mode and Place Typology with Implications for Transit and Land Use Planning (PDF)
- Volume 3: Impact on Where People Live Over Time with Respect to Transit Station Proximity Considering Race/Ethnicity and Household Type and Household Budget by Transit Mode and Place Typology with Implications for Transit and Land Use Planning (PDF)
- Volume 4: Impact on Real Estate Rents with Respect to Transit Station Proximity Considering Type of Real Estate by Transit Mode and Place with Implications for Transit and Land Use Planning (PDF)
- Volume 5: Improving Transit Impacts by Reconsidering Design and Broadening Investment Resources (PDF)
This research was funded by the National Institute for Transportation and Communities, with additional support from the University of Arizona, Tucson.
As principal investigator, Dr. Arthur C. Nelson’s research on this topic spans many years:
- (2012) Do TODs Make a Difference?
- (2013) National Study of BRT Development Outcomes
- (2019) Updating and Expanding LRT/BRT/SCT/CRT Data and Analysis
- (2019) Nationwide Worker Data Repository to Analyze Transit Outcomes - explore links between transit station proximity and real estate rents, jobs, people, and housing
To learn more about this and other NITC research, sign up for our monthly research newsletter.
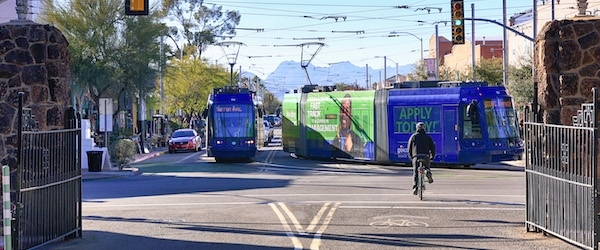
Photo by csfotoimages/iStock
The National Institute for Transportation and Communities (NITC) is one of seven U.S. Department of Transportation national university transportation centers. NITC is a program of the Transportation Research and Education Center (TREC) at Portland State University. This PSU-led research partnership also includes the Oregon Institute of Technology, University of Arizona, University of Oregon, University of Texas at Arlington and University of Utah. We pursue our theme — improving mobility of people and goods to build strong communities — through research, education and technology transfer.
