Watch video

View slides

Summary: Researchers from the transportation, planning and health fields share the common goal of promoting physically active lifestyle. One challenge that researchers often face is the measurement of physical activity, particularly among children. This is because the sporadic nature of children’s physical activity patterns makes it difficult to recall and quantify such activities. Additionally, children’s lower cognitive functioning compared to adults prevents them from accurately recalling their activities. This presentation will describe the design and application of a novel self-report instrument - the Graphs for Recalling Activity Time (GReAT) - for measuring children’s activity time use patterns. The instrument was applied in a study of children’s risk for obesity and diabetes in a predominately Hispanic community in Milwaukee, WI. Time-use data for two weekdays and one weekend day were collected for various physical and sedentary activities. The data was then assessed against measurements of the children’s cardiovascular fitness, weight status and insulin resistance through exploratory analysis and structured equation modeling. Findings on GReAT’s reliability and new evidence on the impacts of time-use in different activities on children’s risk for...

Read more

Watch video

View slides

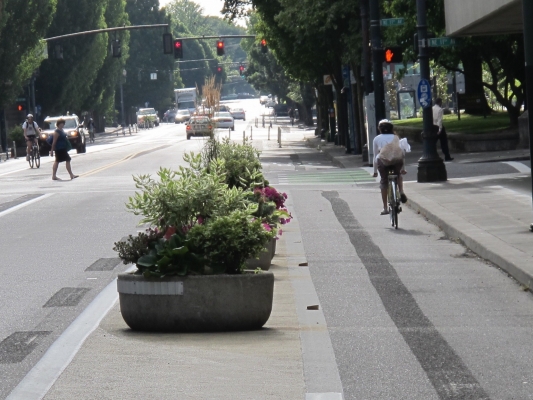
Summary: Cycling is on the rise across the U.S. and its popularity has grown beyond the usual leaders - Portland, OR, Seattle, WA, Davis, CA, Minneapolis, MN and Boulder, CO. New York City, NY Chicago, IL and Washington, DC are among those cities making significant investments in bike infrastructure in recent years and have realized substantial growth in people taking to the streets on two wheels. This presentation will summarize some results from our comprehensive assessment of the safety, operations, economic impacts, user experience, and perceptions of new protected bikeways in 5 cities U.S. cities (Austin, TX; Chicago, IL; Portland, OR; San Francisco, CA; and Washington, D.C.). To support this research, the team collected and analyzed 204 hours of video, 2,300 returned surveys of residents, and 1,111 returned surveys from people intercepted riding the new facilities.

Bios: Dr. Christopher M. Monsere is an Associate Professor of Civil and Environmental Engineering in the Maseeh College of Engineering & Computer Science at Portland State University. Dr. Monsere’s primary research interests are in the areas of multimodal transportation safety; management and dissemination of large transportation datasets; and improvements in transportation...

Read more

The video begins at 0:15.

Watch video

View slides

Summary: This session will describe the process and results of a NHTSA study that showed a change in driver culture of yielding to pedestrians in crosswalks on a citywide basis. The research won the Pat Waller award from the National Academy of Sciences, Transportation Research Board in January of this year. The approach to changing road user behavior focused on an integrated approach that include Enforcement, Engineering, and Educational efforts that were designed to be dovetailed together and that included a social norming component. Additional information will be provided on engineering solutions that can facilitate changes in pedestrian level of service and safety.

Bio: Dr. Van Houten is a Professor of Psychology at Western Michigan University. He has worked in the area of pedestrian safety for thirty years. He is past chairman of the Transportation Research Board’s pedestrian committee and a member of the National Committee on Uniform Traffic Control Devices. He has published extensively in the area of pedestrian safety and recently received along with Dr. Louis Malenfant, Richard Blomberg and Dr. Brad Huitema the Waller Award from the Transportation Research Board for their paper on changing driving culture by increasing driver yielding right-of-way to pedestrians...

Read more

The video begins at 4:40.

A major aspect of transportation planning is understanding behavior: how to predict it and how to influence it over the long term. Transportation models typically emphasize policy variables such as travel time and cost. While clearly important, we hypothesize that other variables may be just as influential, namely, variables related to environmental consequences such as greenhouse gas emissions. This work is motivated by several factors. First, there is evidence from behavioral economics in non-transport domains that providing personalized information regarding environmental impact can significantly modify behavior. Second, applications to transport appear to have potential as many studies find that environmental consciousness influences transport behavior. Third, there are a growing number of transportation websites that are reporting environmental savings. Finally, smartphones provide the technological means to provide real-time, person-specific travel information regarding trip times, costs, and environmental impacts. Results from a computer laboratory experiment will be presented, which indicate that providing informing regarding environmental impacts significantly increases sustainable behaviors. Further, the experiments suggest a “value of green” of around 44-84 cents per pound of CO2 savings.

The video begins at 1:20.

View slides: Foster Presentation (PDF)

View slides: Muhs Presentation (PDF)

View slides: Wagner Presentation (PDF)

Summaries:

Evaluating Driver and Pedestrian Behaviors at Enhanced Multilane Midblock Pedestrian Crossings: Case Study in Portland, Oregon This study examines driver and pedestrian behaviors at two enhanced midblock pedestrian crossings in Portland, Oregon. One crossing is on a five-lane arterial with a posted speed of 35/45 miles-per-hour (MPH) and features six rectangular rapid flash beacon (RRFB) assemblies and a narrow median refuge. The other crossing is on a suburban arterial with four travel lanes and a two-way left-turn lane. The crossing is enhanced with four RRFB assemblies and a median island with a “Z” crossing, or Danish offset, designed to encourage pedestrians to face oncoming traffic before completing the second stage of their crossing. Approximately 62 hours of video have been collected at the two locations. A total of 351 pedestrian crossings are analyzed for driver compliance (yielding) rates, pedestrian...

Read more

Pages